
PAN
Performance
Kiwa PVEL’s PAN testing and .pan file generation enhance PV module performance simulations by using empirical data across a range of temperature and irradiance conditions. This is an essential input for accurate energy models. Unlike manufacturer-provided PAN files, which might lack empirical validation, Kiwa PVEL’s comprehensive testing ensures .pan files reflect real-world conditions more accurately, supporting better decision-making in module procurement and project development.
Key Takeaways
Increased Energy Yields
Better PAN performance once again results in higher energy generation.Energy yields improved due to an increase in TOPCon and HJT BOMs included in the PAN dataset for the 2025 Scorecard, some of which had record high energy yields. The result was the Top Performer threshold for PAN increasing by 0.95% and 0.59% for Kiwa PVEL’s modelled sites in Las Vegas and Boston, respectively. See the PAN Energy Yields graph below for more.

n-Type Temperature Coefficients
TOPCon was clearly better than PERC; HJT was clearly better than both.HJT’s average Pmp temperature coefficient of -0.25%/°C was better than that of both TOPCon (at -0.29%/°C) and PERC (at -0.32%/°C). The HJT and TOPCon values are slightly better than what was reported in the past two Scorecards, as HJT’s temperature behavior maintains its advantage, especially for higher temperature sites. See the Test Result Spotlight below for more.

n-Type Bifacial Gains
TOPCon bifaciality typically beats PERC, but HJT is the clear winner.The average bifaciality was 85.5% for HJT, 76.3% for TOPCon and 68.7% for PERC. Compared to what was reported in the 2024 Scorecard, these averages were slightly lower for HJT and PERC and slightly higher for TOPCon. Higher bifaciality leads to higher energy yields, especially for sites with high albedo. See the Test Result Spotlight below for more.
Low Light Performance
All values less than -2.0%, with minimal cell technology differences.Low light performance (as measured via the relative efficiency deviation at 200 W/m² compared to 1000 W/m²) has been fairly aligned across PERC, TOPCon and HJT BOMs for the past three years. However, BOMs from the 2025 Scorecard dataset had an average low light performance of -3.2% for HJT, -3.8% for TOPCon and -4.2% for PERC. See the Test Result Spotlight below for more.
PAN Test Result
Spotlight
Examining module temperature coefficients, low light performance and bifaciality across the past three years of test results shows HJT technology’s clear performance advantages with regard to temperature coefficients and bifaciality. And while HJT is clearly ahead of TOPCon for these performance characteristics, TOPCon has obvious advantages over PERC for both temperature coefficients and bifaciality. However, with regard to low light performance, a clear technology favorite is less obvious. Kiwa PVEL’s low light performance results show strong overlap between PERC, TOPCon and HJT, with a wider range of values across individual TOPCon and HJT BOMs, than for PERC.
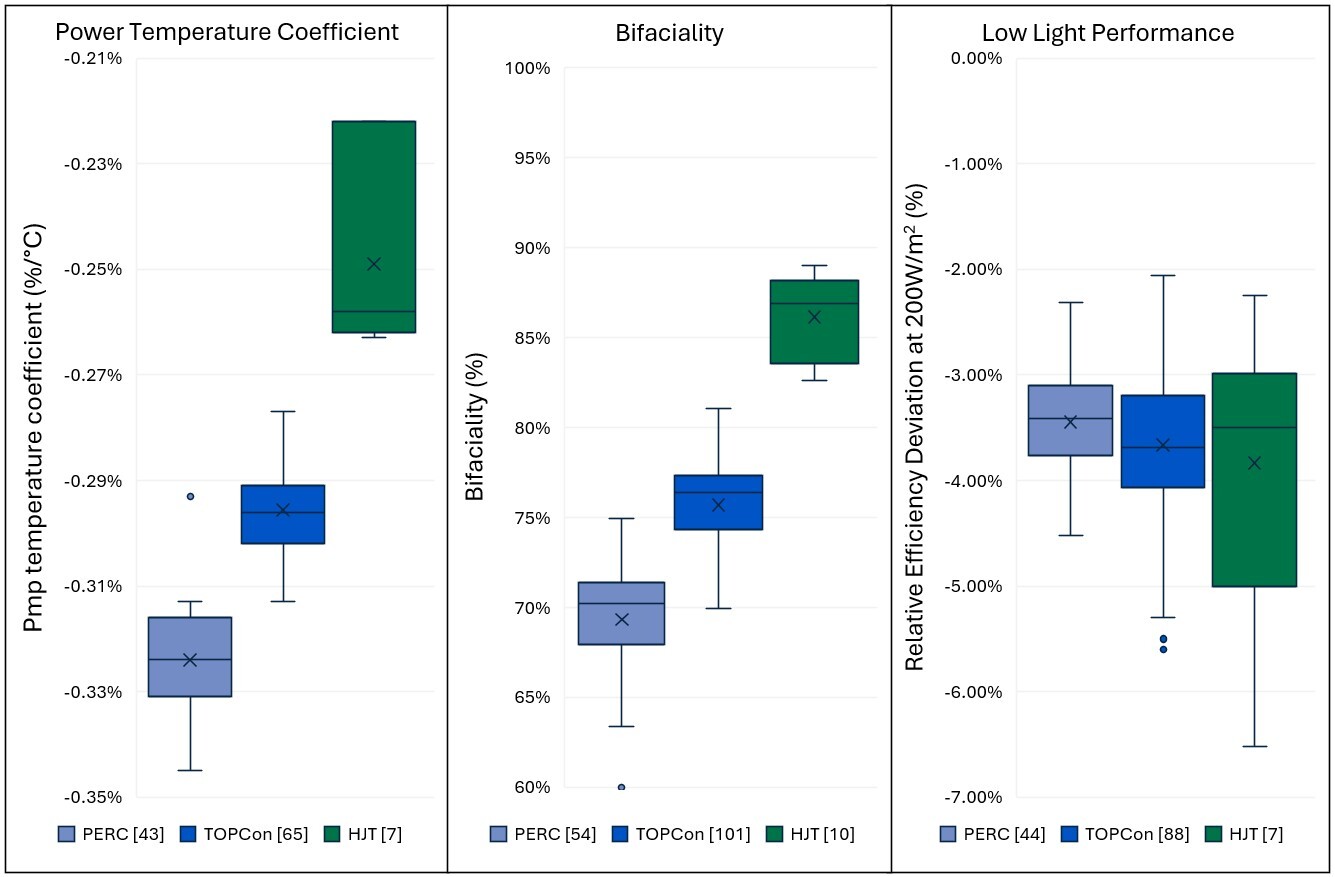
Key PAN file parameters of power temperature coefficient, bifaciality and low light performance results from PQP BOMs produced from 2022 to 2024. BOM quantity per test and per technology are shown in square brackets. Note the HJT sample size is significantly lower than PERC and TOPCon.
PAN Energy
Yields


See PAN Top Performers
Click here to see the 26 BOMs listed as PAN Top Performers.
To illustrate the impact of Kiwa PVEL's PAN files, each PAN report includes simulations based on the Kiwa PVEL-generated PAN file for two sites: a 1 MW site in a temperate climate at a 0° tilt in Boston, USA, and a 1 MW site in a desert climate at 20° tilt in Las Vegas, USA. The PAN reports also include single-axis tracker simulations for the same locations. The result of each of these simulations is a specific energy yield (kWh/kWp) value which can be used for benchmarking purposes.
View Box Plot Interpretation Guide